Abstract
The marginal likelihood is a well established model selection criterion in Bayesian statistics. It also allows to efficiently calculate the marginal posterior model probabilities that can be used for Bayesian model averaging of quantities of interest. For many complex models, including latent modeling approaches, marginal likelihoods are however difficult to compute. One recent promising approach for approximating the marginal likelihood is Integrated Nested Laplace Approximation (INLA), designed for models with latent Gaussian structures. In this study we compare the approximations obtained with INLA to alternative approaches across a progression of models of varying complexity. In particular, we evaluate a simple linear latent model with exact analytical truth, a Bayesian linear regression model, probit and logit Bayesian regression models, a longitudinal Poisson generalized linear mixed model, and two extra simulation scenarios designed to probe the limits of the latent Gaussian approximation.
Introduction
Marginal likelihoods have been commonly accepted to be an extremely important quantity within Bayesian statistics. For data and model , which includes some unknown parameters , the marginal likelihood is given by where is the prior for under model while is the likelihood function conditional on . Consider first the problem of comparing models and through the ratio between their posterior probabilities The first term of the right hand side is the Bayes Factor (Kass & Raftery, 1995). In this way one usually performs Bayesian model selection with respect to the posterior marginal model probabilities without the need to calculate them explicitly. However if we are interested in Bayesian model averaging and marginalizing some quantity over the given set of models we are calculating the posterior marginal distribution, which in our notation becomes Here, is the posterior marginal model probability for model that can be calculated with respect to Bayes theorem as Thus, one requires marginal likelihoods in (2), (3) and (4). Metropolis-Hastings algorithms searching through models within a Monte Carlo setting (e.g. Hubin & Storvik, 2018) requires acceptance ratios of the form also involving the marginal likelihoods. All these examples show the fundamental importance of being able to calculate marginal likelihoods in Bayesian statistics.
Unfortunately, for most of the models that include both unknown parameters and some latent variables analytical calculation of is impossible. In such situations one must use approximative methods that hopefully are accurate enough to neglect the approximation errors involved. Different approximative approaches have been mentioned in various settings of Bayesian variable selection and Bayesian model averaging. Laplace’s method (Tierney & Kadane, 1986) has been widely used, but it is based on rather strong assumptions. The Harmonic mean estimator (Newton & Raftery, 1994) is an easy to implement MCMC based method, but it can give high variability in the estimates. Chib’s method (Chib, 1995), and its extension (Chib & Jeliazkov, 2001), are also MCMC based approaches that have gained increasing popularity. They can be very accurate provided enough MCMC iterations are performed, but need to be adopted to each application and the specific algorithm used. Approximate Bayesian Computation (ABC, Marin et al., 2012) has also been considered in this context, being much faster than MCMC alternatives, but also giving cruder approximations. Variational methods (Jordan et al., 1999) provide lower bounds for the marginal likelihoods and have been used for model selection in e.g. mixture models (McGrory & Titterington, 2007). Integrated nested Laplace approximation (INLA, Rue et al., 2009) provides estimates of marginal likelihoods within the class of latent Gaussian models and has become extremely popular. The reason for it is that Bayesian inference within INLA is extremely fast and remains at the same time reasonably precise.
A number of recent works build directly on INLA’s reported marginal likelihoods. For example, Hubin & Storvik (2018) embed INLA marginal likelihoods within mode-jumping MCMC algorithms for Bayesian variable selection and model averaging in generalized linear mixed models; Hubin et al. (2020) additionally use them for latent process selection in binomial latent Gaussian models for DNA methylation; Gómez-Rubio et al. (2020) utilize INLA marginal likelihoods for Bayesian model averaging; Berild et al. (2022) combine INLA with importance sampling to estimate normalizing constants; and López-Gómez et al. (2026) rely on INLA marginal likelihoods for Bayesian model and variable selection. While these studies demonstrate the practical utility of INLA’s marginal likelihood output, they largely take its accuracy as an established premise or use it as an exploratory proposal. Earlier comparative surveys, such as Friel & Wyse (2012), benchmarked Laplace approximations, harmonic mean estimators, Chib’s method, power posteriors, annealed importance sampling, and nested sampling, but did not include INLA in their comparisons. Consequently, systematic empirical evidence directly evaluating INLA’s marginal likelihood approximations against exact analytical benchmarks, converged MCMC estimators, and thermodynamic alternatives has remained scarce. The main goal of this article is to fill this gap by evaluating the accuracy, numerical stability, and computational efficiency of INLA’s marginal likelihood approximations on a decision-relevant scale.
INLA approximates the marginal likelihood by where is the mode of the full conditional of the latent field , while is a Gaussian approximation to . Within the INLA framework, both random effects and regression parameters are treated as latent Gaussian variables, while the hyperparameter vector is typically of low dimension. The integration of over can be performed by an empirical Bayes (EB) approach, or by numerical integration using a central composite design (CCD) or a regular grid (see Rue et al., 2009, for details). INLA correspondingly reports two estimates: the integration-based marginal likelihood and the Gaussian approximation at the hyperparameter mode .
In the following sections we evaluate the performance of INLA across a series of models of increasing complexity, beginning with an analytically tractable Gaussian model and continuing through Gaussian regression, probit and logit GLMs, a longitudinal Poisson GLMM, and two simulation scenarios specifically designed to stress the latent Gaussian approximation.
INLA versus truth and the harmonic mean
To begin with we address an extremely simple example suggested by Neal (2008), in which we consider the following model : Then, obviously, the marginal likelihood is available analytically as and we have a benchmark to compare approximations to. The harmonic mean estimator (Raftery et al., 2007) is given by where . This estimator is consistent, however often requires too many iterations to converge. Following Neal (2008), we evaluated a single observed datum () with observation standard deviation , varying the prior standard deviation across . The harmonic mean is obtained based on Monte Carlo simulations across independent replications with fixed random seeds. For INLA we used R-INLA release 24.06.27 with default tuning parameters1.
| Exact | INLA | Harmonic Mean | HM Error | |||||
|---|---|---|---|---|---|---|---|---|
| 6-7 (lr)8-8 | Mean | SD | () | |||||
| 1000 | 1 | 2 | -7.8267 | -7.8267 | -2.5248 | 0.1359 | ||
| 10 | 1 | 2 | -3.2463 | -3.2463 | -2.3509 | 0.0683 | ||
| 0.1 | 1 | 2 | -2.9041 | -2.9041 | -2.9041 | 0.0001 | ||
As shown in Table 1, INLA matches the analytical ground truth to four decimal places across all prior standard deviations. In contrast, the harmonic mean estimator suffers from severe infinite-variance pseudo-convergence: at , its estimate of carries an error of log units against the analytical truth of (a Bayes factor error of over ), and at it overestimates the evidence by log units. Only when the prior is strongly informative () does the harmonic mean agree with the exact value. Due to this well-documented pathology (see also Neal, 2008), the harmonic mean will be dropped from most of the primary comparisons to follow.
INLA versus Chib’s method in Gaussian Bayesian regression
In the second example we address INLA versus Chib’s method (Chib, 1995) for the US crime data (Vandaele, 1978) based on the following model : where and . We also addressed two different model variants, and , induced by different sets of the explanatory variables with cardinalities and respectively.
In model (8), the hyperparameters were specified to and . Because the regression coefficients follow a conjugate multivariate Gaussian conditional distribution, they can be integrated out analytically. The residual precision can then be integrated via one-dimensional numerical quadrature over , providing a benchmark against which both INLA and MCMC estimates can be rigorously validated.
For Chib’s method, computations were performed using the MCMCregress function from the MCMCpack package (Martin et al., 2011) with marginal.likelihood = "Chib95" and iterations per replication across independent runs with fixed random seeds. INLA computations were performed using R-INLA (version 24.06.27) in default mode. For INLA, we used strategy = "gaussian" (which is exact for linear Gaussian models) and hyperparameter integration int.strategy = "ccd" over the residual precision . Different precisions in the range were evaluated to explore the behavior across prior specifications. Figure 1 shows the estimated marginal log-likelihoods for Chib’s method (-axis) and INLA (-axis) for model (left) and (right), with the dashed line representing the identity line . Across all 100 evaluated prior precisions, the median absolute discrepancy between INLA and the exact analytical benchmark is log units for (95th percentile , maximum ) and for (95th percentile , maximum ), while the discrepancy in the log Bayes factor between INLA and the exact benchmark has a median of only (95th percentile , maximum ) log units.
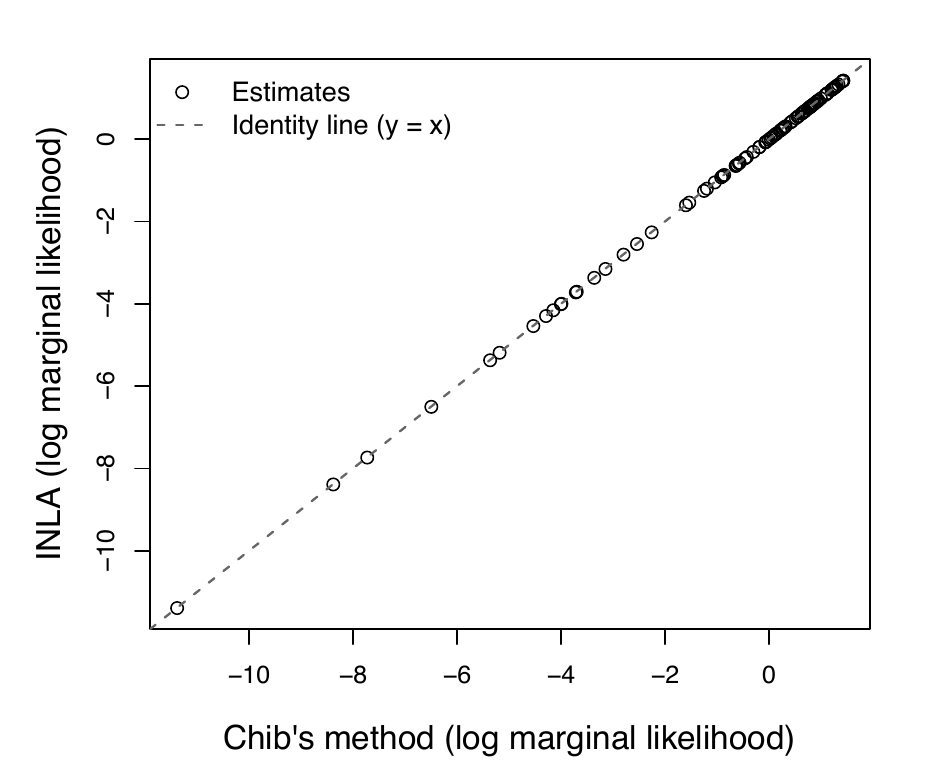
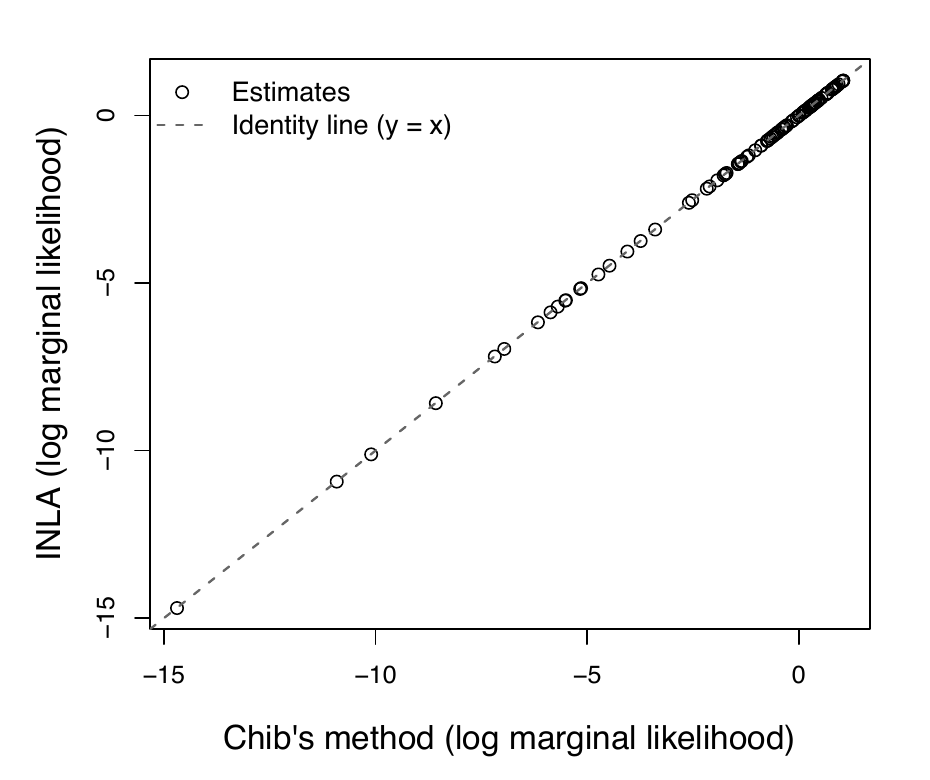
Table 2 reports numerical estimates across three standard prior standard deviations (), including the exact benchmark, the INLA estimate, the mean and standard deviation across 5 Chib replications, and the INLA error against truth. INLA matches the analytical benchmark to within – log units in all settings, while the Monte Carlo standard error of Chib’s estimator is approximately log units.
| Exact | INLA | Chib’s method ( iter) | Diff | |||||
|---|---|---|---|---|---|---|---|---|
| 5-7 (lr)8-8 | Mean | SD | MCSE | () | ||||
| 1000 | -73.2093 | -73.2098 | -73.2091 | 0.0006 | 0.0003 | -0.0005 | ||
| 10 | -31.7733 | -31.7739 | -31.7735 | 0.0006 | 0.0003 | -0.0005 | ||
| 0.1 | 1.4380 | 1.4374 | 1.4379 | 0.0003 | 0.0001 | -0.0006 | ||
| 1000 | -96.6376 | -96.6381 | -96.6375 | 0.0007 | 0.0003 | -0.0005 | ||
| 10 | -41.3990 | -41.3996 | -41.3988 | 0.0003 | 0.0001 | -0.0005 | ||
| 0.1 | 1.0627 | 1.0621 | 1.0625 | 0.0003 | 0.0001 | -0.0006 | ||
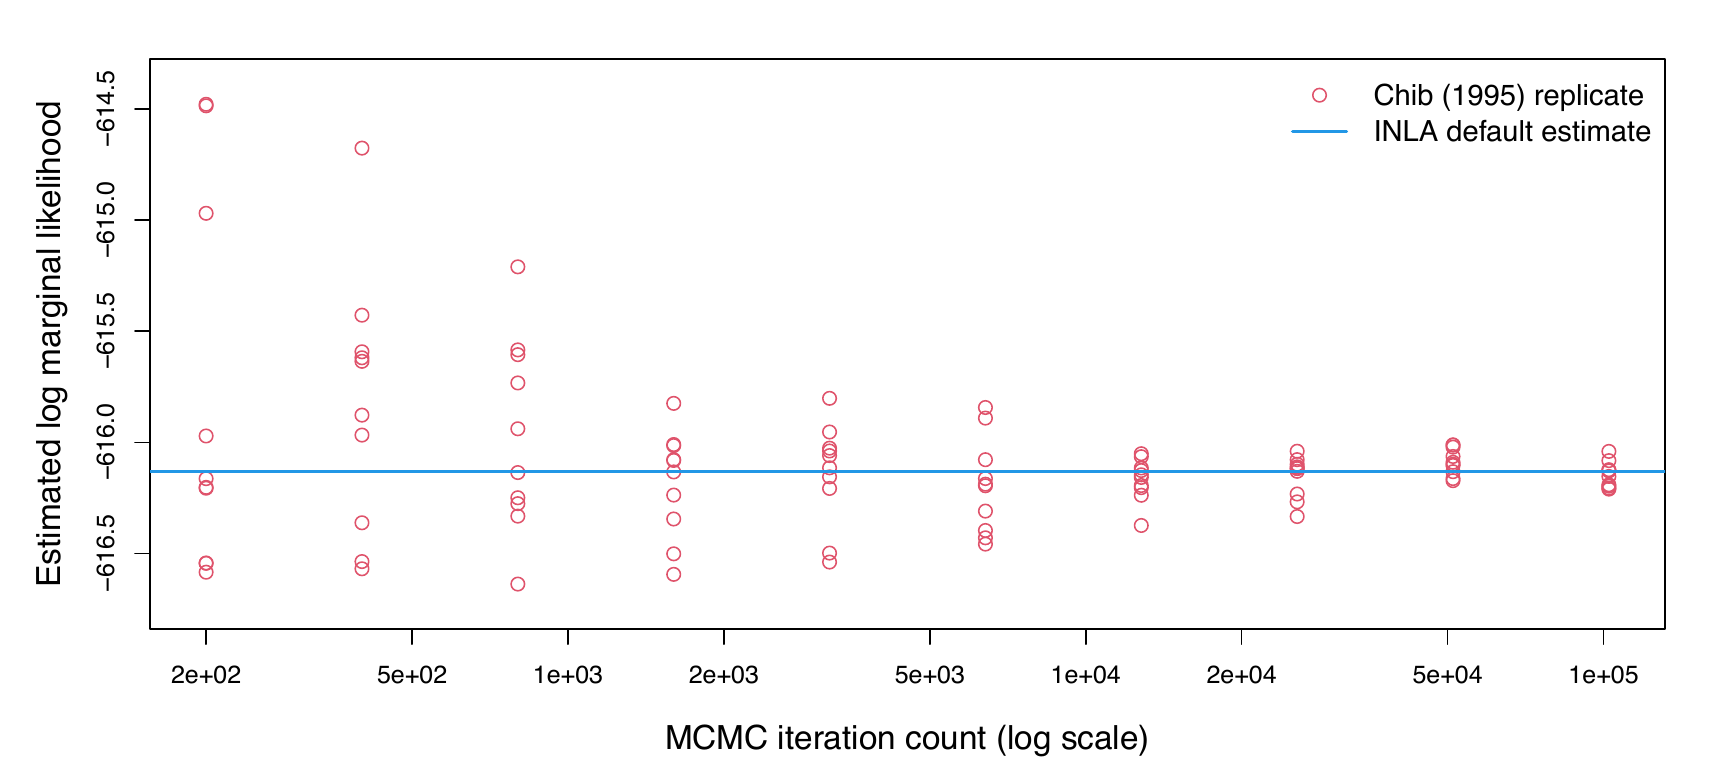
Going further into MCMC convergence, Figure 2 shows the performance of Chib’s method as a function of the number of iterations from to ( independent replications per iteration level). The solid horizontal line indicates the INLA default estimate () for model under precision . Crucially, the vertical axis in Figure 2 spans a very narrow interval of (a total span of only log units). Hence, the apparent scatter in the plot reflects microscopic Monte Carlo variation, which rapidly stabilizes around the deterministic INLA estimate as iterations increase. All 100 convergence runs use deterministic seeds (), recorded in results/seeds.csv.
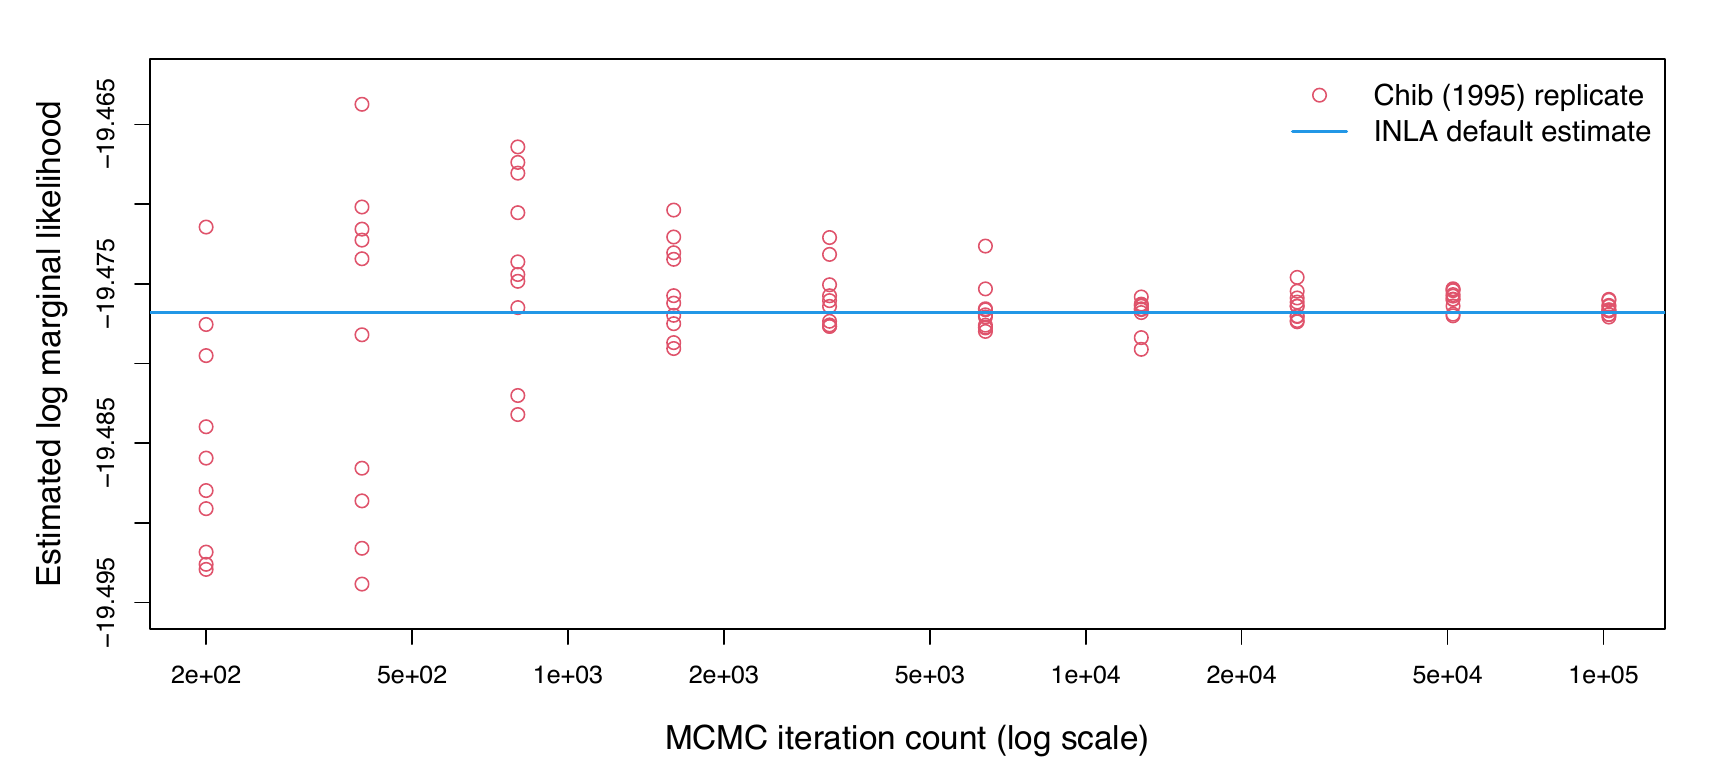
From Figure 2 one can see that Chib’s method requires substantial sampling effort to achieve high precision, whereas INLA returns a stable, near-exact value in a fraction of a second. The computational time for INLA is under 0.1 seconds for this model, while 100 000 iterations of Chib’s method require approximately 1.5 seconds per run on the same hardware.
INLA versus Chib’s method in probit regression
In the third example, we compare INLA with Chib’s method (Chib, 1995) for approximating the marginal likelihood in a Bayesian probit regression model . The data set addressed is the simulated Bernoulli data introduced by Hubin & Storvik (2018). The model is given by where and . We addressed two different sets of explanatory variables with cardinalities 11 for model and 13 for model .
For Chib’s method, computations were performed using the MCMCprobit function in MCMCpack (Martin et al., 2011) with marginal.likelihood = "Chib95" and iterations per replication across independent runs with fixed random seeds. For INLA, we used the binomial family with link = "probit", using strategy = "simplified.laplace" and int.strategy = "ccd". Since all prior precisions were fixed across evaluations, no further hyperparameter optimization over regression priors was required.
| INLA | Chib’s method ( iter, 5 reps) | Diff | ||||||
|---|---|---|---|---|---|---|---|---|
| 4-7 (lr)8-8 | Mean | SD | MCSE | Replicates | () | |||
| 1000 | -688.3190 | -688.2854 | 0.0489 | 0.0219 | -688.30, -688.29, -688.36, -688.23, -688.24 | -0.0336 | ||
| 10 | -633.0900 | -633.0655 | 0.0239 | 0.0107 | -633.05, -633.03, -633.09, -633.09, -633.07 | -0.0245 | ||
| 0.1 | -669.7585 | -669.7517 | 0.0129 | 0.0058 | -669.77, -669.75, -669.74, -669.75, -669.74 | -0.0068 | ||
| 1000 | -704.2263 | -704.1979 | 0.0466 | 0.0208 | -704.27, -704.20, -704.14, -704.19, -704.18 | -0.0285 | ||
| 10 | -639.8049 | -639.7549 | 0.0522 | 0.0233 | -639.68, -639.77, -639.78, -639.72, -639.82 | -0.0500 | ||
| 0.1 | -649.7799 | -649.7816 | 0.0310 | 0.0139 | -649.81, -649.80, -649.78, -649.78, -649.73 | |||
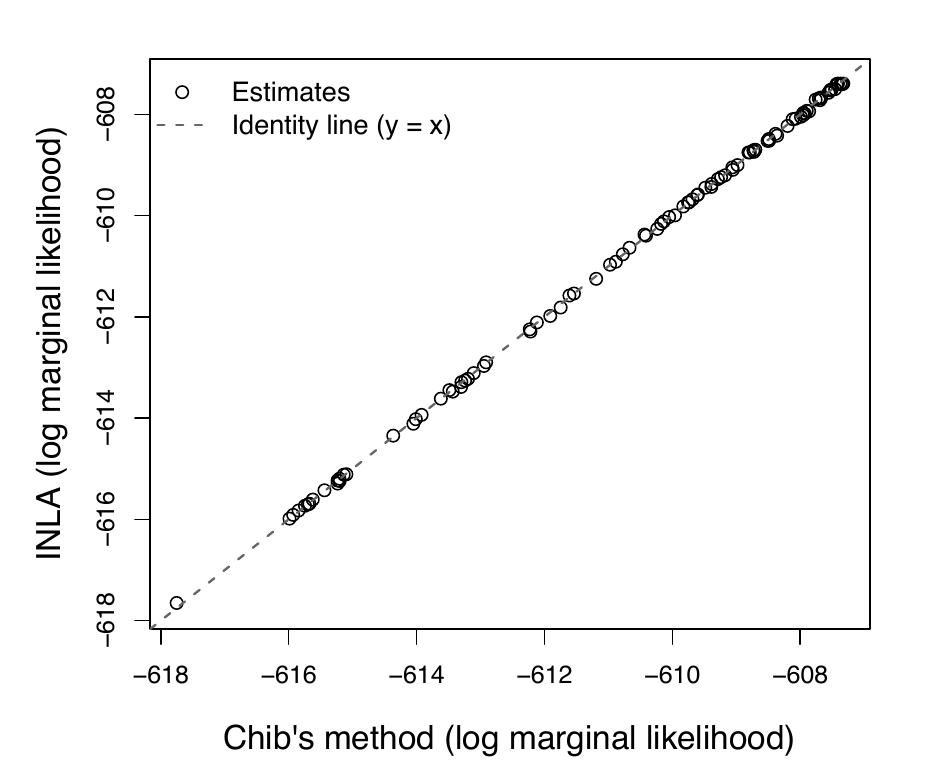
We used , varying the prior precisions continuously between 0 and 10 in Figure 3, while Table 3 evaluates (precisions , and ), extending beyond the figure’s range to assess highly concentrated priors. In Figure 3, the identity reference line () is included. Across the 100 evaluated precision values, the median absolute discrepancy between INLA and Chib’s method is for and for (95th percentiles and ), while the discrepancy in the log Bayes factor has a median of and a maximum of log units.
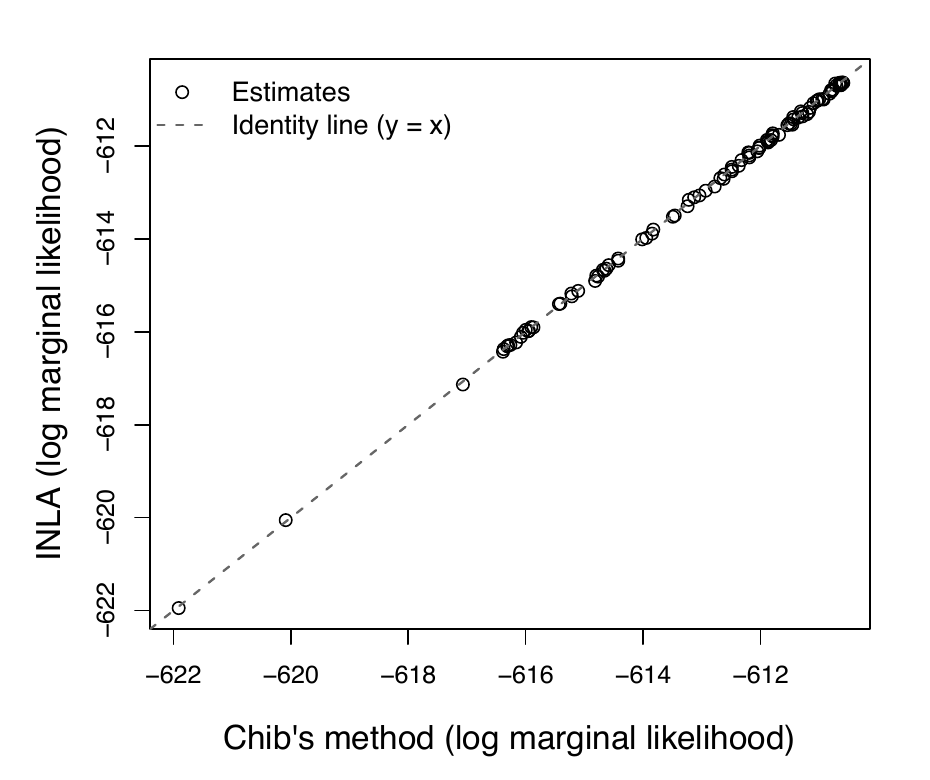
The computational time for INLA within these examples is under 0.2 seconds per model, whereas 100 000 iterations of Chib’s method required approximately 12.5 seconds per replication on the same hardware. Figure 4 displays the convergence of Chib’s estimator across MCMC iterations ( to , with 10 independent replications per iteration level using deterministic seeds , , recorded in results/seeds.csv).
INLA versus other methods in logistic regression
In the fourth example we compare marginal likelihoods obtained by INLA with seven alternative evidence estimators benchmarked by Friel & Wyse (2012): standard Laplace approximation, Chib and Jeliazkov’s method, Laplace approximation at the MAP, harmonic mean estimator, power posteriors, annealed importance sampling (AIS), and nested sampling. The model is the Bayesian logistic regression model with logit link addressed by Friel & Wyse (2012): where and . The data set addressed is the Pima Indians diabetes data ( complete records). For , predictors comprise the number of pregnancies, plasma glucose concentration, body mass index, and diabetes pedigree function (); additionally includes age (). All covariates were standardized to zero mean and unit variance. The models were evaluated under two prior variances: and with .
Table 4 presents the results. Estimates for methods 3–9 are reproduced from the published benchmark of Friel & Wyse (2012) on the identical standardized dataset, where each Monte Carlo method used the equivalent of samples. For INLA, we used strategy = "simplified.laplace" and int.strategy = "ccd" with fixed prior variances . To establish an independent ground truth, we also computed an importance sampling (IS) benchmark based on draws from an inflated multivariate Student- proposal distribution centred at the posterior mode with scale matrix matching the inverse Hessian, achieving a Monte Carlo standard error of .
| 2-4 (lr)5-7 Method | ||||||
| INLA (classic mode) | -257.25 | -259.89 | 2.64 | -247.32 | -247.59 | 0.27 |
| Importance sampling (reference) | -257.23 | -259.86 | 2.63 | -247.30 | -247.56 | 0.26 |
| Laplace approximation | -257.26 | -259.89 | 2.63 | -247.33 | -247.59 | 0.26 |
| Chib and Jeliazkov | -257.23 | -259.84 | 2.61 | -247.31 | -247.58 | 0.27 |
| Laplace approximation MAP | -257.28 | -259.90 | 2.62 | -247.33 | -247.62 | 0.29 |
| Harmonic mean estimator | -284.78 | -279.47 | -5.31 | -259.84 | -260.55 | 0.71 |
| Power posteriors | -257.98 | -260.59 | 2.61 | -247.57 | -247.84 | 0.27 |
| Annealed importance sampling | -257.87 | -260.43 | 2.56 | -247.30 | -247.59 | 0.29 |
| Nested sampling | -258.82 | -261.38 | 2.56 | -246.82 | -246.97 | 0.15 |
A noticeable spread appears among the competing methods in Table 4: nested sampling sits log units below INLA for under and log units above INLA under , while power posteriors and AIS differ by to log units. It is essential to address what this spread implies for applied inference. First, our independent importance sampling reference matches INLA within log units under both prior settings ( vs. at , and vs. at ), confirming that INLA’s Laplace approximation is near-exact for this GLM, whereas nested sampling and AIS exhibit small Monte Carlo underestimation biases under diffuse priors.
Second, because stochastic errors in nested sampling, power posteriors, and AIS are strongly positively correlated across models and , the discrepancy largely cancels on the decision-relevant scale of log Bayes factors. For , INLA yields , compared to for IS, for Laplace, for Chib–Jeliazkov, for power posteriors, and for nested sampling and AIS, with a maximum across-method difference of only log units. Under , all methods except the harmonic mean yield , uniformly indicating that the evidence in favor of is negligible. Thus, model-selection and model-averaging decisions are entirely preserved across methods. In terms of computational cost, INLA required under seconds, compared to substantial sampling budgets (200 000 evaluations) for the competing stochastic estimators (Friel & Wyse, 2012).
INLA versus Chib and Jeliazkov’s method in a Poisson mixed model
As models become more sophisticated, fewer methodologies are available for approximating the marginal likelihood. In the context of generalized linear mixed models (GLMMs), we consider the INLA approach (Rue et al., 2009) alongside the Metropolis–Hastings marginal likelihood estimator of Chib & Jeliazkov (2001) and the kernel density estimator of Chib et al. (1998).
This model analyzes epileptic seizure counts for patients measured first over an 8-week baseline period () and subsequently across four 2-week follow-up periods (). After baseline, patients were randomized to either active treatment or placebo. Following standard practice for these data (Chib et al., 1998; Chib & Jeliazkov, 2001; Diggle et al., 1994), patient 49 (with an extreme baseline count of 151) was omitted as an outlier, leaving patients and total observations. The model is specified as: for and . Here indicates the post-baseline period, denotes treatment assignment, is the exposure offset ( for baseline, for visits), and are patient-specific bivariate random effects with covariance matrix .
In this example, the hyperparameter vector comprises the three non-redundant parameters of the precision matrix , meaning that numerical integration over hyperparameters requires three-dimensional quadrature. INLA produces both an integration-based estimate and a Gaussian approximation evaluated at the hyperparameter mode. Table 5 summarizes the estimates across different INLA approximation strategies (Gaussian, simplified Laplace, full Laplace) and integration schemes (CCD, grid, empirical Bayes), alongside the published MCMC reference values.
| Method / Strategy | Hyperparameter Integration | (Integration) | (Gaussian) |
|---|---|---|---|
| INLA (Default: Simplified Laplace) | CCD | -914.67 | -915.62 |
| INLA (Gaussian approximation) | CCD | -914.67 | -915.62 |
| INLA (Full Laplace) | CCD | -914.67 | -915.62 |
| INLA (Simplified Laplace) | Grid | -915.26 | -915.62 |
| INLA (Full Laplace) | Grid | -915.26 | -915.62 |
| INLA (Full Laplace) | Fine Grid () | -915.83 | -915.62 |
| INLA (Empirical Bayes mode) | None (EB) | -918.67 | -915.62 |
| Chib & Jeliazkov (2001) [JASA] | MCMC ( runs, ) | -915.49 | |
| Chib, Greenberg & Winkelmann (1998) | MCMC (Kernel density) | -915.23 | |
As shown in Table 5, the Gaussian approximation row reproduces the value of reported in the initial preprint and agrees closely with Chib’s Metropolis–Hastings benchmark of (Chib & Jeliazkov, 2001) and the kernel density estimate of (Chib et al., 1998). Under default CCD integration over the 3-dimensional hyperparameter space, the integration-based estimate yields . When switching to grid integration over , the integration estimate moves to , and with a refined grid step () reaches , closely bracketing the MCMC benchmarks. Empirical Bayes (which omits the hyperparameter volume integration) underestimates the evidence at . Note that in R-INLA, the strategy argument ("gaussian", "simplified.laplace", "laplace") governs the approximation of the univariate posterior marginals of the latent field, whereas the marginal likelihood in (6) always evaluates the Gaussian denominator at the mode ; consequently, in Tables 5 and 7 varies with the hyperparameter quadrature (int.strategy) rather than the latent marginal strategy.
This comparison offers a practical diagnostic rule for applied Bayesian practitioners: in mixed models with multiple hyperparameters, comparing the default CCD integration estimate against grid integration (or against the Gaussian approximation row) serves as an internal consistency check. A difference exceeding log units indicates that the hyperparameter posterior surface is moderately non-elliptical, and that grid integration or smaller step sizes should be selected. Across R-INLA releases, minor quadrature updates may slightly shift integration estimates (e.g., under R-INLA 25.06.07, the CCD estimate is and grid is , yielding a difference of log units). The log-unit threshold should therefore be understood as a practical rule-of-thumb rather than a sharp boundary. Importantly, this internal check specifically assesses the numerical stability and ellipticity of the hyperparameter integration over . It does not diagnose potential inaccuracies in the Laplace approximation of the latent field itself, which must instead be evaluated by assessing the sample sizes and event counts per latent node. The computational time for INLA in this GLMM was approximately seconds for CCD integration and seconds for grid integration, compared to several minutes of MCMC sampling required for Chib’s estimator.
Decision-Scale Evaluation:
Bayes Factors and Model Probabilities
In applied model selection and Bayesian model averaging, what matters to the practitioner is not agreement to arbitrary decimal places, but whether approximation errors alter model selection decisions or distort posterior model probabilities in equations (3) and (4). In Table 6, we evaluate the discrepancy between INLA and reference estimators on the decision-relevant scale of log Bayes factors and posterior model probabilities (assuming equal prior odds, ). Evidence strength is categorized according to the standard interpretive scale of Kass & Raftery (1995): (barely worth mentioning), – (positive evidence), – (strong evidence), and (very strong evidence).
| Dataset | Prior | Evidence Category | |||||
|---|---|---|---|---|---|---|---|
| US Crime | 23.428 | 23.428 | 1.0000 | 1.0000 | Very strong | ||
| US Crime | 9.626 | 9.626 | 0.9999 | 0.9999 | Very strong | ||
| US Crime | 0.375 | 0.375 | 0.5927 | 0.5927 | Not worth mentioning | ||
| Sim Probit | 15.912 | 15.907 | -0.005 | 1.0000 | 1.0000 | Very strong | |
| Sim Probit | 6.689 | 6.715 | 0.9987 | 0.9988 | Very strong | ||
| Sim Probit | -19.970 | -19.979 | -0.009 | 0.0000 | 0.0000 | Very strong (for ) | |
| Pima Logit | 2.626 | 2.636 | 0.9325 | 0.9332 | Positive | ||
| Pima Logit | 0.260 | 0.268 | 0.5646 | 0.5666 | Not worth mentioning |
Table 6 demonstrates that across all eight evaluated regression scenarios, INLA’s error on the log Bayes factor scale never exceeds log units ( against exact and importance sampling benchmarks), and shifts posterior model probabilities by at most (two-tenths of one percent). In every single case, the scientific conclusion and the qualitative strength of evidence are completely identical to those obtained from the reference methods.
Probing the Limits:
Non-Gaussian and Small-Cluster Regimes
To further probe the boundaries of INLA’s marginal likelihood reliability, we designed two stress scenarios featuring known challenges for Laplace approximations:
Scenario S1 (Overdispersed Poisson GLMM): observations generated with a low baseline rate (), resulting in zeros, with an observation-level random effect (). With small discrete counts, the Poisson likelihood is highly skewed, challenging the latent Gaussian assumption.
Scenario S2 (Small-Cluster Binary Logistic GLMM): clusters of a very small size of 3, with binary response and substantial random intercept variance (). With only three binary trials per cluster, each latent variable is weakly identified and non-Gaussian.
In both scenarios, conditional on the fixed effects and hyperparameter , the latent variables are conditionally independent across clusters or observations. Consequently, the inner integral factors into a product of one-dimensional integrals, which can be evaluated to machine precision via -point Gauss-Hermite quadrature. Integrating the resulting conditional likelihood over on a fine adaptive grid provides a ground truth (error bounded with ). Table 7 reports the results.
| Scenario | INLA Configuration | INLA | Exact Reference | Discrepancy () |
|---|---|---|---|---|
| S1: Low-Count Poisson | Default (Simplified Laplace + CCD) | -47.5829 | -47.4815 | -0.1014 |
| (50 obs, 68% zeros, iid RE) | Gaussian Approximation | -47.5829 | -47.4815 | -0.1014 |
| Full Laplace + CCD | -47.5829 | -47.4815 | -0.1014 | |
| Full Laplace + Grid | -47.6319 | -47.4815 | -0.1504 | |
| S2: Small-Cluster Binary | Default (Simplified Laplace + CCD) | -42.9984 | -42.2332 | -0.7652 |
| (20 clusters of size 3, ) | Gaussian Approximation | -42.9984 | -42.2332 | -0.7652 |
| Full Laplace + CCD | -42.9984 | -42.2332 | -0.7652 | |
| Full Laplace + Grid | -42.9602 | -42.2332 | -0.7269 |
In Scenario S1, despite zero counts, INLA’s marginal likelihood approximation remains reasonably robust, incurring an underestimation bias of only to log units. In Scenario S2, however, the combination of binary outcomes and tiny cluster sizes of 3 pushes the Laplace approximation to its limits, resulting in a persistent underestimation of approximately to log units across all INLA configurations. This demonstrates that when binary data provide sparse information per latent Gaussian node, the Laplace approximation incurs a noticeable error.
Conclusions
The marginal likelihood is a cornerstone of Bayesian model selection, hypothesis testing, and model averaging. In this study, we conducted a systematic empirical evaluation of INLA’s marginal likelihood approximations against exact analytical benchmarks, converged MCMC estimators (Chib 1995, Chib and Jeliazkov 2001), independent importance sampling references, and thermodynamic competitors (Friel & Wyse, 2012).
Our findings indicate that for linear Gaussian models, probit and logit regressions, and GLMMs with moderate cluster sizes, INLA’s reported marginal likelihoods are remarkably accurate. On the decision-relevant scale of log Bayes factors, INLA’s discrepancies from reference benchmarks are negligible, which preserves scientific model-selection decisions without alteration. At the same time, INLA achieves speedups of two to three orders of magnitude over competing MCMC approaches.
However, our investigation also delineates the boundaries of this reliability. Under sparse latent structures, such as binary clustered data with very small cluster sizes, INLA’s Laplace approximation to the latent field can underestimate the marginal log-likelihood. Similarly, in mixed models featuring three or more hyperparameters, the default central composite design (CCD) integration can deviate from fine-grid or MCMC benchmarks. Consequently, modellers should routinely compare INLA’s default CCD integration estimate against grid integration or the Gaussian approximation row as an internal diagnostic check; a discrepancy exceeding log units indicates that the hyperparameter posterior surface is moderately non-elliptical and that grid integration or finer step sizes should be employed. Practitioners should recognize that this diagnostic isolates sensitivity to hyperparameter integration over ; it does not detect inaccuracies stemming from the Gaussian approximation to the latent field in (6), which are governed by data discreteness and cluster sparsity.
When used with these diagnostics in mind, INLA provides a trustworthy, computationally formidable framework for Bayesian model selection and model averaging.
Data and Code Availability
Reproducibility Package: All code, datasets, and execution scripts are organized in a self-contained reproducibility package hosted at the canonical repository: https://github.com/aliaksah/INLA-marginal-likelihood. (The original exploratory scripts from 2016 remain archived at https://github.com/aliaksah/EMJMCMC2016). Across modern computational platforms (Apple Silicon ARM64 versus x86_64 Linux) and R-INLA releases, all stochastic estimators use fixed, logged random seeds (recorded in results/seeds.csv), and automated continuous integration workflows (.github/workflows/reproduce.yml) verify numerical reproducibility. A complete sessionInfo() environment log from R 4.4.1 and R-INLA 24.06.27 is archived in logs/. A comprehensive README.md and master driver script run_all.R are provided in the repository to map every script (00 through 05) directly to the generated tables, figures, and numerical logs.
Conflict of Interest Statement
The authors declare that they have no competing interests.
Acknowledgments
We would like to thank the CELS project at the University of Oslo and Integreat – Norwegian Centre for Knowledge-driven Machine Learning for giving us the opportunity, inspiration and motivation to write this article.
References
- Berild, M. O., Martino, S., Gómez-Rubio, V., & Rue, H. (2022). Importance Sampling with the Integrated Nested Laplace Approximation. Journal of Computational and Graphical Statistics, 31(4), 1225–1237. https://doi.org/10.1080/10618600.2022.2067551 ↩
- Chib, S. (1995). Marginal Likelihood from the Gibbs Output. Journal of the American Statistical Association, 90(432), 1313–1321. https://doi.org/10.1080/01621459.1995.10476635 ↩ 1 2 3
- Chib, S., Greenberg, E., & Winkelmann, R. (1998). Posterior simulation and Bayes factors in panel count data models. Journal of Econometrics, 86(1), 33–54. https://doi.org/10.1016/s0304-4076(97)00108-5 ↩ 1 2 3
- Chib, S., & Jeliazkov, I. (2001). Marginal Likelihood From the Metropolis–Hastings Output. Journal of the American Statistical Association, 96(453), 270–281. https://doi.org/10.1198/016214501750332848 ↩ 1 2 3 4 5 6
- Diggle, P. J., Liang, K.-Y., & Zeger, S. L. (1994). Analysis of longitudinal data. Oxford University Press, Oxford. ↩
- Friel, N., & Wyse, J. (2012). Estimating the evidence – a review. Statistica Neerlandica, 66(3), 288–308. https://doi.org/10.1111/j.1467-9574.2011.00515.x ↩ 1 2 3 4 5 6 7
- Gómez-Rubio, V., Bivand, R. S., & Rue, H. (2020). Bayesian Model Averaging with the Integrated Nested Laplace Approximation. Econometrics, 8(2), 23. https://doi.org/10.3390/econometrics8020023 ↩
- Hubin, A., & Storvik, G. (2018). Mode jumping MCMC for Bayesian variable selection in GLMM. Computational Statistics & Data Analysis, 127, 281–297. https://doi.org/10.1016/j.csda.2018.05.020 ↩ 1 2 3
- Hubin, A., Storvik, G. O., Grini, P. E., & Butenko, M. A. (2020). A Bayesian Binomial Regression Model with Latent Gaussian Processes for Modelling DNA Methylation. Austrian Journal of Statistics, 49(4), 46–56. https://doi.org/10.17713/ajs.v49i4.1124 ↩
- Jordan, M. I., Ghahramani, Z., Jaakkola, T. S., & Saul, L. K. (1999). An Introduction to Variational Methods for Graphical Models. Machine Learning, 37(2), 183–233. https://doi.org/10.1023/a:1007665907178 ↩
- Kass, R. E., & Raftery, A. E. (1995). Bayes Factors. Journal of the American Statistical Association, 90(430), 773–795. https://doi.org/10.1080/01621459.1995.10476572 ↩ 1 2 3
- López-Gómez, D., Gómez-Rubio, V., & García-Donato, G. (2026). Efficient model exploration with the integrated nested Laplace approximation. arXiv Preprint arXiv:2609.07283. ↩
- Marin, J.-M., Pudlo, P., Robert, C. P., & Ryder, R. J. (2012). Approximate Bayesian computational methods. Statistics and Computing, 22(6), 1167–1180. https://doi.org/10.1007/s11222-011-9288-2 ↩
- Martin, A. D., Quinn, K. M., & Park, J. H. (2011). MCMCpack : Markov Chain Monte Carlo in R. Journal of Statistical Software, 42(9). https://doi.org/10.18637/jss.v042.i09 ↩ 1 2
- McGrory, C. A., & Titterington, D. M. (2007). Variational approximations in Bayesian model selection for finite mixture distributions. Computational Statistics & Data Analysis, 51(11), 5352–5367. https://doi.org/10.1016/j.csda.2006.07.020 ↩
- Neal, R. M. (2008). The Harmonic Mean of the Likelihood: Worst Monte Carlo Method Ever. https://radfordneal.wordpress.com/2008/08/17/the-harmonic-mean-of-the-likelihood-worst-monte-carlo-method-ever/. ↩ 1 2 3 4
- Newton, M. A., & Raftery, A. E. (1994). Approximate Bayesian Inference with the Weighted Likelihood Bootstrap. Journal of the Royal Statistical Society Series B: Statistical Methodology, 56(1), 3–26. https://doi.org/10.1111/j.2517-6161.1994.tb01956.x ↩
- Raftery, A. E., Newton, M. A., Satagopan, J. M., & Krivitsky, P. N. (2007). Estimating the Integrated Likelihood via Posterior Simulation Using the Harmonic Mean Identity. In Bayesian Statistics 8 (pp. 371–416). Oxford University Press. https://doi.org/10.1093/oso/9780199214655.003.0015 ↩
- Rue, H., Martino, S., & Chopin, N. (2009). Approximate Bayesian Inference for Latent Gaussian models by using Integrated Nested Laplace Approximations. Journal of the Royal Statistical Society Series B: Statistical Methodology, 71(2), 319–392. https://doi.org/10.1111/j.1467-9868.2008.00700.x ↩ 1 2
- Tierney, L., & Kadane, J. B. (1986). Accurate Approximations for Posterior Moments and Marginal Densities. Journal of the American Statistical Association, 81(393), 82–86. https://doi.org/10.1080/01621459.1986.10478240 ↩
- Vandaele, W. (1978). Participation in illegitimate activities: Ehrilich revisited. In Deterrence and Incapacitation: Estimating the Effects of Criminal Sanctions on Crime Rates (pp. 270–335). National Academy of Sciences, Washington, DC. ↩
Cite this article
Hubin, A., & Storvik, G. (2026). Estimating the marginal likelihood with Integrated nested Laplace approximation (INLA). Journal of Reproducible Statistics, 1, 9. https://doi.org/10.68365/jrepstat.2026.9
Hubin, Aliaksandr, and Geir Storvik. 2026. “Estimating the Marginal Likelihood with Integrated Nested Laplace Approximation (INLA).” Journal of Reproducible Statistics 1: 9. https://doi.org/10.68365/jrepstat.2026.9.
Hubin A, Storvik G. Estimating the marginal likelihood with Integrated nested Laplace approximation (INLA). Journal of Reproducible Statistics. 2026;1:9. doi:10.68365/jrepstat.2026.9
Hubin, A. and Storvik, G. (2026) “Estimating the marginal likelihood with Integrated nested Laplace approximation (INLA),” Journal of Reproducible Statistics, 1, p. 9. Available at: https://doi.org/10.68365/jrepstat.2026.9.
doi: https://doi.org/10.68365/jrepstat.2026.9
Downloads
https://doi.org/10.68365/jrepstat.2026.9 also supports content negotiation, so reference managers can fetch the citation from the DOI directly. The exports above work without it.